Impact of State Demographics on Energy-Related Companies
Summary: The goal of this report is to evaluate a better investment option among the three major energy-based companies i.e. Sempra Energy, CenterPoint Energy, and Dominion Energy. It focuses to see how the demographic distribution in a state impacts energy production, consumption, and distribution over the period. The evolution of energy consumption in industrial, commercial, residential, and transportation sectors forms the base of the investment decision. It relates to the company revenues, growth perspectives, and the challenges faced by the companies to survive in the industry. I have also considered the credit rating from the major agencies such as Moody’s, Standard Poor’s, and Fitch to back the investment decision. Based on the below analysis, Dominion Energy is the best investment option amongst the three.
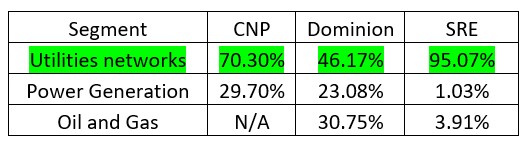
The below table represents the segment distribution in all the three companies which will help us identify the revenue generation and the degree of its impact on the demographics. (Source: Bloomberg)
Introduction:
The United States is a leader in the production, supply, and consumption of energy. U.S. energy companies produce oil, natural gas, coal, renewable fuels, as well as electricity from clean energy sources. The U.S. energy system continues to evolve. Technological innovation, expanded production, gains in efficiency, and changing business models have resulted in changes in employment that are more difficult to track over time. The diversity and breadth of energy industries across the United States create significant challenges for economic modeling and traditional labor market data collection. Growing consumer demand and world-class innovation – combined with a competitive workforce and supply chain capable of building, installing, and servicing all energy technologies – make the United States one of the world’s most attractive markets. According to the International Energy Agency (IEA), total investment in the U.S. energy sector was valued at $350 billion in 2018 (the second largest in the world). That same year, total foreign direct investment in the U.S. industry reached $172.8 billion.
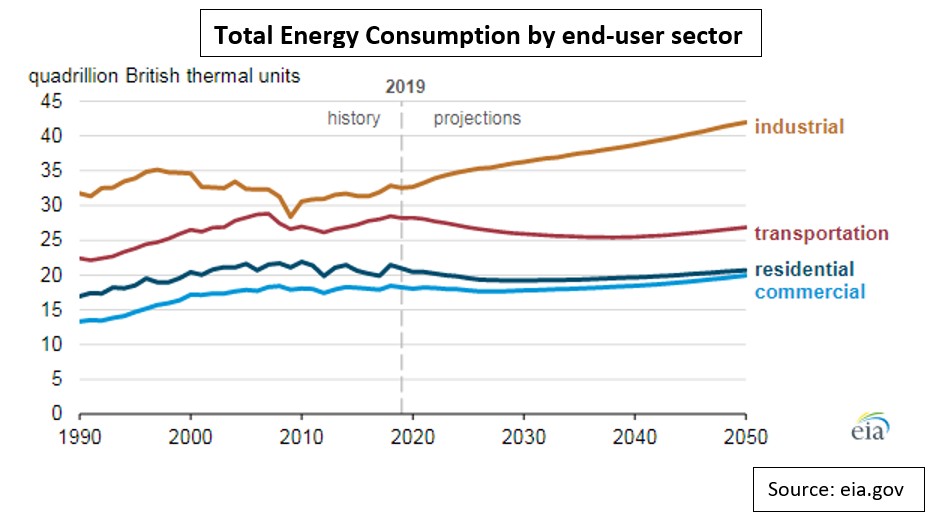
The U.S. industrial sector consumes more energy than any other sector, and its energy use grows faster than any other sector at an average annual rate of 0.8% through 2050 as per the 2020 Energy projections. Energy intensity in the U.S. industrial sector—measured as energy consumption per dollar of output—declines by 0.4% per year on average through 2050, mainly because EIA expects less energy-intensive manufacturing industries to grow faster than more energy-intensive manufacturing industries. According to EIA Projections, the Energy consumed in the U.S. transportation sector is projected to decline by 0.2% on average annually between 2019 and 2050. The energy intensity associated with other transportation modes such as rail, bus, and air travel are also projected to decline with an increase in the adoption of energy-efficient technologies and practices.
U.S. residential energy consumption growth is flat between 2019 and 2050(as per the EIA Projections), and commercial energy consumption growth averages 0.3% annually. Currently established efficiency standards and incentives lead to energy efficiency improvements. These improvements and growth in distributed electricity generation, including on-site solar, partially offset the effects of growth in the U.S. population, households, and commercial floor space.
The global contributions from buildings toward energy consumption, both residential and commercial, have steadily increased between 20%-40%. Growth in population, increasing demand for building services, and comfort levels, together with the rise in time spent inside buildings, assure the upward trend in energy demand will continue in the future.
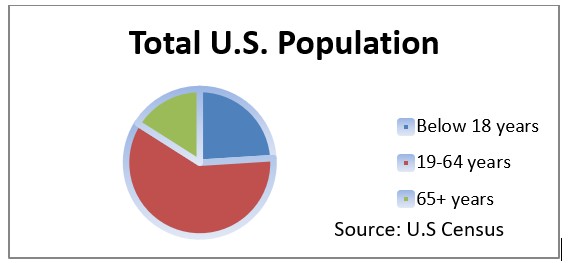
The demographics of the US are at an inflection point, and population trends will have profound implications for the economies of each state. The population across the country is currently estimated to be close to 329.45 million with the below demographics.
Sempra Energy (SRE):
Sempra Energy is an energy services holding company with operations throughout the United States, Mexico, and other countries in South America. The Company, through its subsidiaries, generates electricity, delivers natural gas, operates natural gas pipelines and storage facilities, and operates a wind power generation project. Its operating companies include Southern California Gas Company (SoCalGas) and San Diego Gas Electric (SDGE) in Southern California; Oncor Electric Delivery Company (Oncor) in Texas; Sempra LNG; and IEnova, based in Mexico. In 2018, it has reported more than $11.6 Billion in revenue serving more than 40 million customers. The two major locations in the states happen to be California and Texas where most consumers use Sempra energy. The customer base of these two locations is summarized below: (Data Source: Bloomberg/Hoover Report)
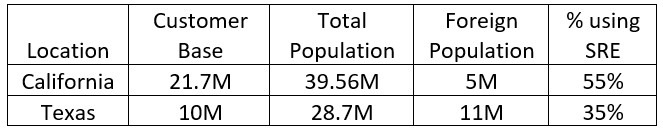
Sempra Energy began operating in California in 1881 and for more than 20 years now in Texas. Most recently, in May 2019, the company acquired a 50% limited partnership interest in Sharyland Utilities, LLC. Sempra Energy is also the majority owner of Oncor Electric Delivery Company LLC (Oncor), the largest electric transmission and distribution utility in Texas, serving more than 10 million consumers. In 2019, Sempra Energy also supported Oncor's acquisition of InfraREIT, Inc. Through the acquisitions of Oncor, InfraREIT, and Sharyland, Sempra Energy has made investments of more than $10 billion in Texas.
CentrePoint Energy (CNP):
CenterPoint Energy, Inc. is one of the largest public utility holding companies in the U.S., distributes natural gas and electricity to more than 7 million customers. The Company, through its subsidiaries, conducts activities in electricity transmission and distribution, natural gas distribution, interstate pipeline and gathering operations, and power generation. The below chart represents the various segments of CNP and its revenue contribution: (Data Source: Bloomberg/Hoover Report)
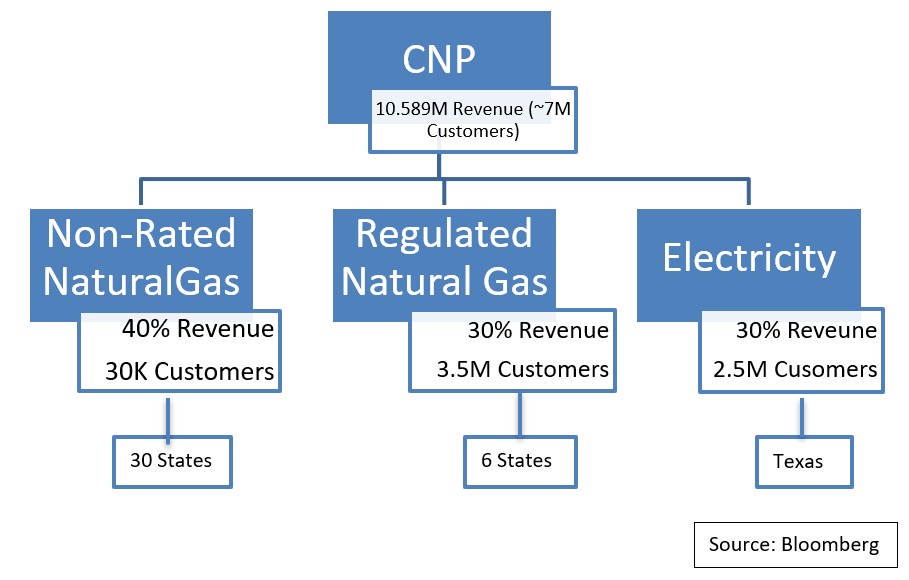
CenterPoint Energy has grown dramatically in the past few years by acquiring complementary businesses to expand its core electric and gas operations. The acquisitions of parts of Continuum’s business and Atmos, as well as the Vectren merger, bolster its growth potential. CenterPoint and Vectren Corporation merged in 2019, with Vectren becoming a consolidated subsidiary of CenterPoint. The combined company now has electric and natural gas delivery operations in eight states with assets totaling $29 billion, making it one of the top US energy delivery companies with access to 7 million customers.
Two other acquisitions, Atmos Energy's retail energy business (Atmos Energy Marketing) and Continuum's retail energy services and wholesale gas business, grew CenterPoint's customer base to over 100,000 in the last two years.
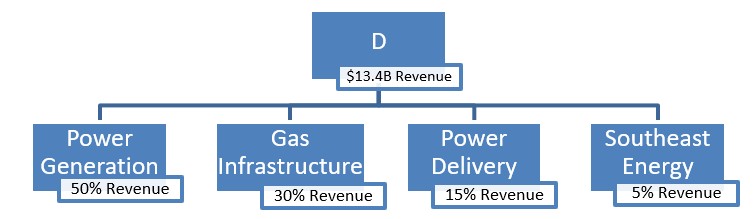
Dominion Energy (D):
Dominion Energy, Inc. offers natural gas and electric energy transmission, gathering, and storage solutions. Dominion Energy serves customers in the United States. It dominates the American energy market as one of its top distributors of electricity and natural gas. The company serves some 7.5 million retail energy customers across eight US states, with a special concentration in Virginia, the Carolinas, and Ohio. (Data Source: Bloomberg/Hoover Report)
Dominion is focusing on its regulated power and gas infrastructure assets to reduce its exposure to volatile energy markets. It acquired western US gas utility Questar in 2016 and southeastern US utility SCANA in 2019. The firm exited certain retail energy marketing operations in 2018; it also sold three merchant power generation plants for $1.3 billion and its 50% stake in the midstream gas services provider Blue Racer for $1.2 billion.
Dominion's five-year investment plan for the 2019-23 periods includes $10 billion in facility upgrades within the Power Delivery segment to meet growing customer demand. The company is working to modernize Virginia Power's electric grid by adding renewable resource connections, underground assets, and smart-grid devices. Another $10 billion is allotted to new assets in the Power Generation segment, with a focus on alternative energy investments.
Factors Influencing Energy Demand:
Energy demand is influenced by several factors. For example, building characteristics, the willingness to invest in energy efficiency measures, the way individuals inhabit their dwellings, as well as households’ socio-economic and demographic attributes – including age. We consider various factors that affect energy consumption and production in the United States:
Climatic factors:
Changes in temperature, sea-level, and the frequency of extreme events affect energy demand, supply, and consumption, especially for heating and cooling. It plays an important role in day-to-day life. Our energy production is linked with various aspects of modern life such as water consumption, use of goods and services, transportation, economic growth, and population growth.
The global temperatures climb and summer heatwaves both intensify and multiply. It may mean thinking of innovative building solutions for elderly residences, like incorporating solar panels and making energy-saving changes to building design.
This report studies three main companies located in various parts of the country which has varied climatic conditions.
Sempra: Sempra mainly operates in the Southern region of America. The climate in these states is mainly known for a hot and humid climate with mild winters. In such a climate, Americans will use more electricity for air conditioning and less natural gas or oil for heating.
CenterPoint Energy: CenterPoint Energy has its major operations in the southern part of the United States. This region is mainly known for its extreme climates throughout the year. These states consume more electricity in summer and a lot of oil and natural gas for heating in winter.
Dominion: Dominion also operates in the southern part of the United States and the states consume a lot of energy resources. It exited a few of the retail energy marketing operations in 2018, but still serves 7.5 Million customers spread in 18 states.
Age and Household Income:
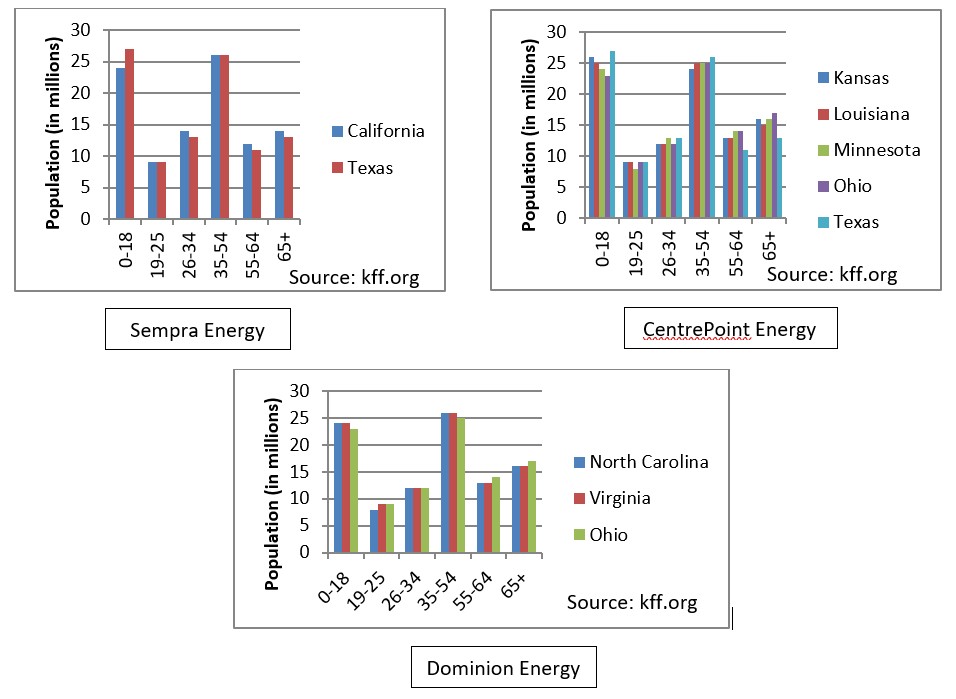
The energy consumption depends largely upon the household income in each state. A low household income acts as a negative contributor as the usage of gas and electricity reduces. The income of an elderly household is low as compared to the middle of the working-age groups. Whereas the energy consumption per capita increases as the age increases. Therefore, we can say that the age and energy consumption have an inverse relationship, whereas the household income and energy consumption have a positive correlation. The below chart represents the average household income of the major states considered in this report and the average annual income per household in the United State is $ 61,937. Ohio, North Carolina, and Louisiana are having the average income lower than the average income of the country which indicates that these states might have a lower usage of gas and electricity. All three states have an elderly population of about 16-17% of the total state population. We see that all the states have the largest population in the middle-aged group and the children below 18 years of age.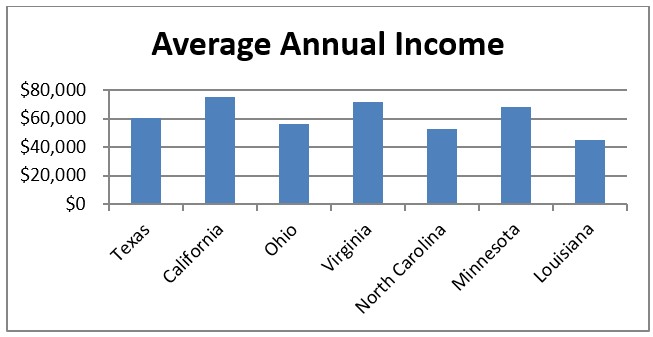
The three charts below represent the age-wise population in the major states where SRE, D, CNP operates:
Age and household size:
All else being equal, do households with older members demand more energy than those consisting of younger members? Researchers concluded that household size plays a key role in the energy use of elderly households. They found that elderly households tend to higher energy consumption per capita. A reason for this finding may be the concurrent loss of economies of scale in elderly households. Elderly people generally prefer higher room temperatures for space heating. As 90 % of elderly people are pensioners, they spend more time at home which, in turn, leads to more hours of heating.
Analyses of the Residential Energy Consumption Survey in the United States also show that per capita residential energy expenditure rises with households’ age (O’Neill Chen 2002, 53).
Research shows that residential energy usage increases with age, as young adults leave their homes in their late teens or early 20s. Consumption remains flat until individuals reach their 30s and then climbs to a peak in their mid-50s, roughly coinciding with the end of family rearing. From 55 to 64 is another period of slow growth, with consumption increasing rapidly after age 70.
In September, the U.S. Census Bureau targeted 2035 as the year the U.S. will pass an important population milestone: The elderly will outnumber children for the first time in the nation’s history. Estimates expect 78 million Americans will be 65 and older that year versus 76.7 million are younger than 18. Population aging is going to have huge impacts in the future, starting soon.
Sempra Energy:
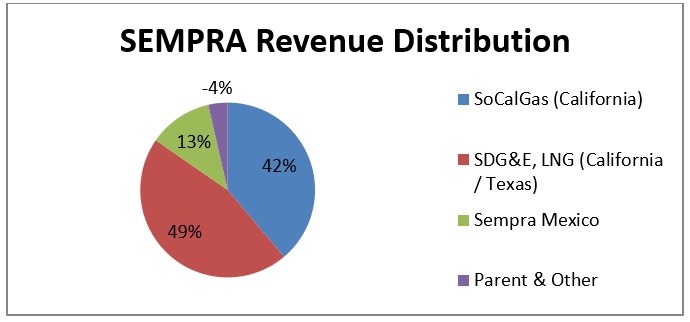
Sempra has its operations in California, Texas, and Mexico where more than 87% of the revenue is generated by California and Texas in the United States. Below is the graphical representation of Sempra’s revenue distribution as per the geographic location of the Sempra’s subsidiaries. The data has been picked up from SRE 10-K 2019. The total Revenue of SRE for 2019 was $ 10,829 with Net Income to be $2,362 (~21%). Therefore, I have considered only California and Texas for further analysis of energy distribution and consumption.
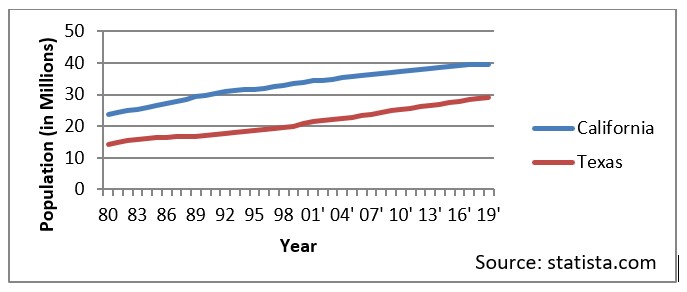
The below graph represents the population growth over the years in California and Texas:
Texas:
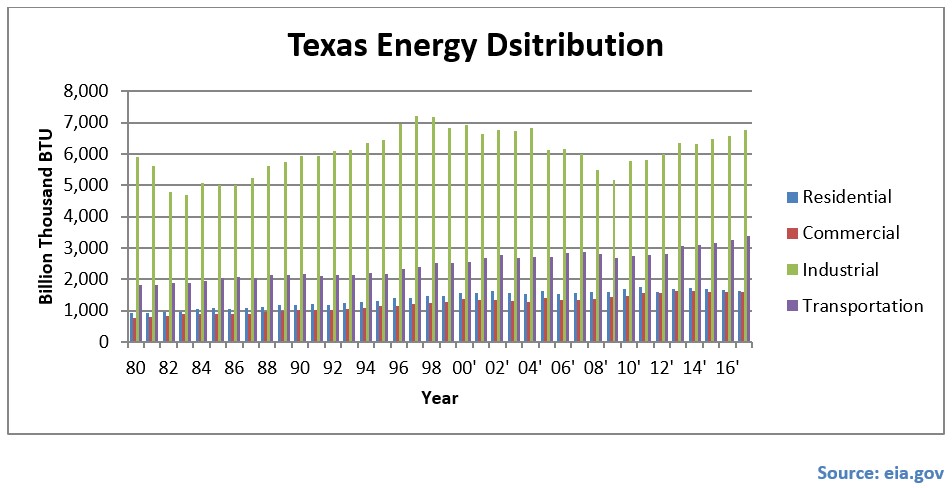
Texas accounts for nearly 13% of the energy consumed in the U.S. California uses only 60% of the energy that Texas uses where the population is 12 million higher than that of Texas. When we consider the energy usage adjusted by population, Texas is better in being conservation-minded. Texas is one of the bottom 20 states that use residential energy consumption per capita. Although the energy consumed by the industrial sector is the highest, increasing overall, it has seen some fluctuations. The fluctuations can be partly attributed to variations in energy prices. More than 50% of the energy used in Texas is for industrial purposes. Transportation accounts for nearly about 25% while commercial is even lower than residential. Texas is the largest state that is the net exporter of energy while California is the net importer.
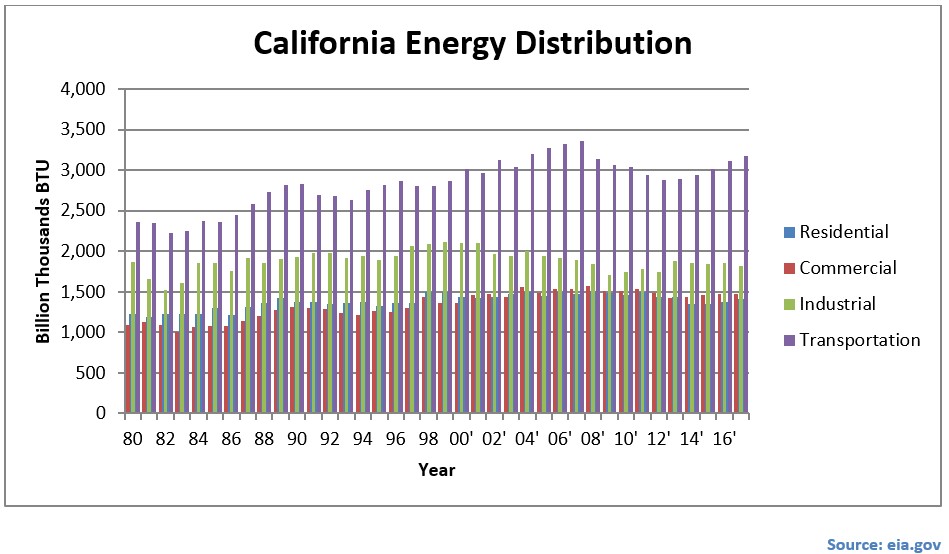
California:
California is the second-largest state after Texas in energy consumption in the U.S. Transportation accounts for nearly 40% of the total energy consumption in California. Most of its energy is consumed in transportation due to longer commutes; a larger population with low availability of public transport which results in a higher number of motor vehicles. As of 2018, California is the leader of electric vehicles and there is continuous growth since then. The second-largest is the industrial sector in energy consumption, while the consumption in the energy sector is relatively low due to mild climates throughout the year.
California uses a lot of private vehicles due to insufficient public transportation services. Also, there is an increasing number of electric vehicles in California which is still expected to rise in the future. Therefore, we see the maximum energy usage consists of Transportation. On the other hand, it is observed that Texas is one of the states that have a conservative mindset in terms of energy consumption. The population is comparatively less in Texas but is considered as home to all segments of industries which includes electric and computer products, electrical appliances, and components, motor vehicles, textile, apparel and leather products, petroleum, chemical and coal products, etc. Texas ranks highest among states in the energy sector in terms of employment and total energy production.
CenterPoint Energy:
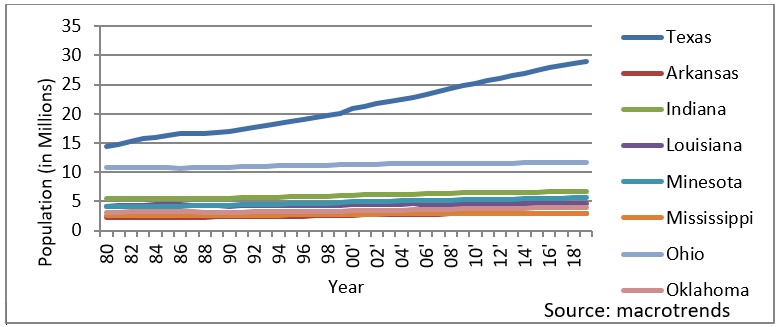
CNP is majorly operating in the states that have low population growth over the years. We see that the population in Arkansas, Indiana, Louisiana, Minnesota, Mississippi, and Oklahoma ranges between 2.5 Million to 5.5 Million since the 1980s. Therefore, energy consumption in the residential and transportation sector has not increased to a great extent. It operates in Texas that has a greater population, but it is very conservative in terms of energy consumption in the residential sector while it has a larger room for energy consumption in the industrial sector.
The below graph represents the population growth over the years where Sempra has its major operations:
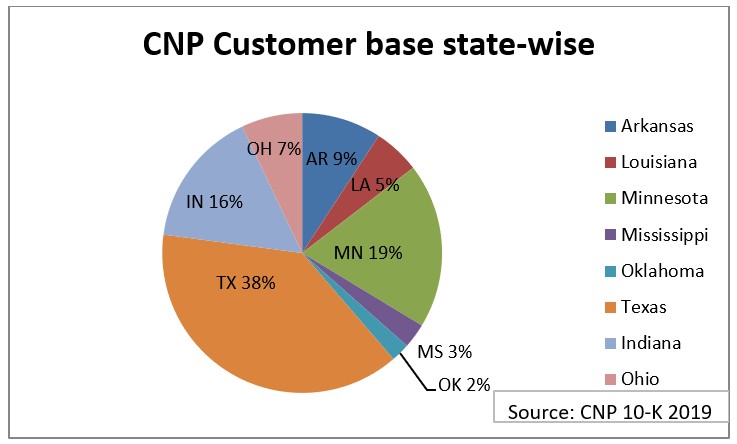
CNP has its operations in more than 8 states and is engaged in various business segments such as Electric, natural gas, infrastructure, corporate, and other energy services; it is difficult to get its revenue state-wise. I have taken the customer base in each state for further analysis.
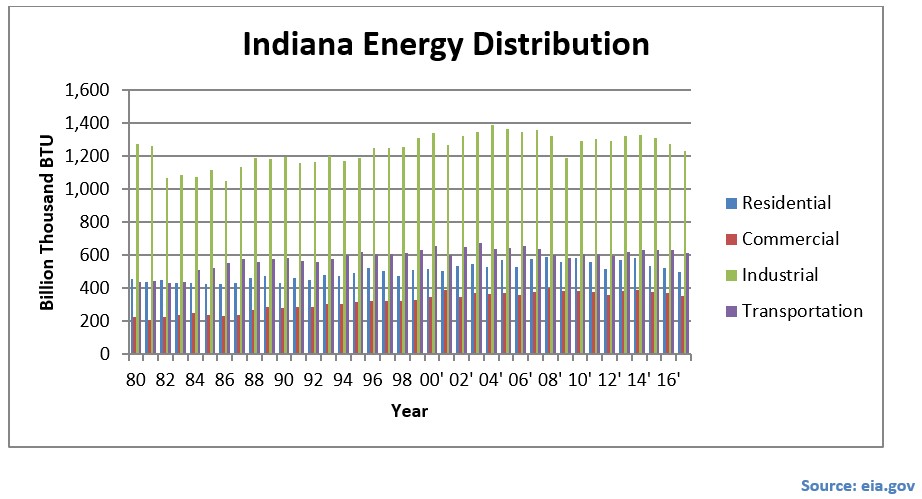
Indiana:
The industrial sector, which includes chemicals, steel, and agriculture, is the largest end-use energy-consuming sector in Indiana and accounts for almost half the energy used in the state. Indiana has an energy-intensive private sector due to its strong manufacturing base - energy use in Indiana's commercial and industrial sectors accounts for 66.5% of Indiana's energy consumption. With the rise of energy costs over time, many businesses see the value in becoming more energy efficient so that they can use less energy but still produce the same number of high-quality products. Undergoing an energy audit is a good first step to increasing a facility's energy efficiency, and many electric and gas utilities offer rebates so that businesses can start saving money and energy even faster.
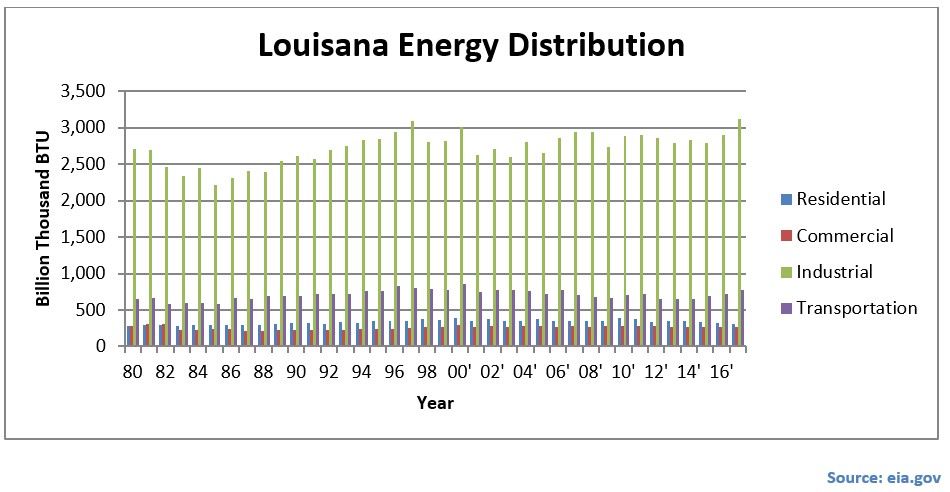
Louisiana:
The industrial sector drives energy consumption in Louisiana. It uses up to 70% of the total energy consumption in the state. Louisiana is amongst the top 10 states in the U.S for energy used per person, out of which residential and the transportation sector has the least share. Traditional and emerging industries are growing in Louisiana. The high energy consumption is the result of a large-scale industrial sector which includes energy-intensive chemical, petroleum, and natural gas industries and a modest population. A highly productive workforce, low state taxes, and undisrupted infrastructure and logistics play an important role in growing industries in the state. The state has a pro-business climate and it is the nation’s best recruitment and training program, which adds as a competitive advantage for a better industrial area.
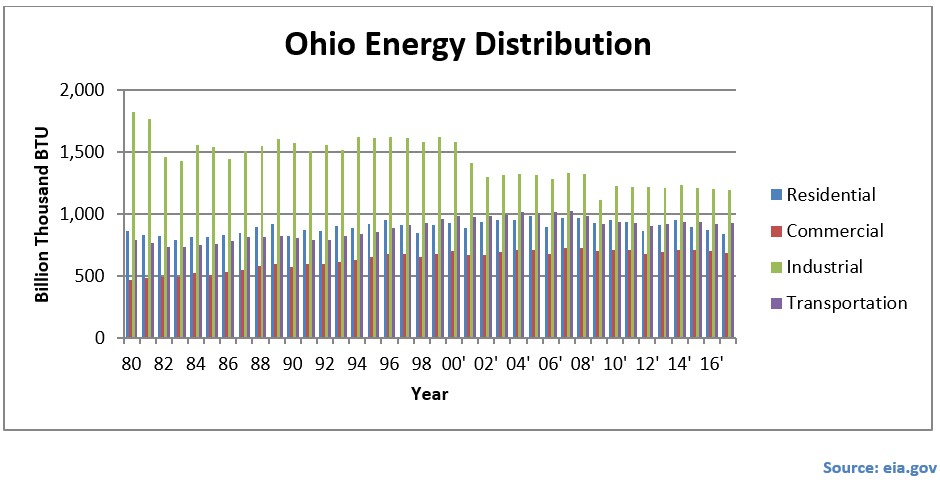
 Ohio:
Ohio:
Ohio’s economy is driven by its robust manufacturing sector, led by high energy-intensive industries, such as strong metals fabrication and chemical production industries. The industrial sector in energy consumption shows the most varied behavior amongst all other sectors. Historical economic singularities involving sudden, significant, and sustained increases in energy prices have led to a decline in the industrial demand for energy. Ohio’s economy has continued to become more service-oriented than manufacturing-oriented. The expansion of the service sector leads to an increase in consumption in commercial energy. The energy consumption in the residential sector shows a downtrend due to increased prices and other state energy conservation measures.
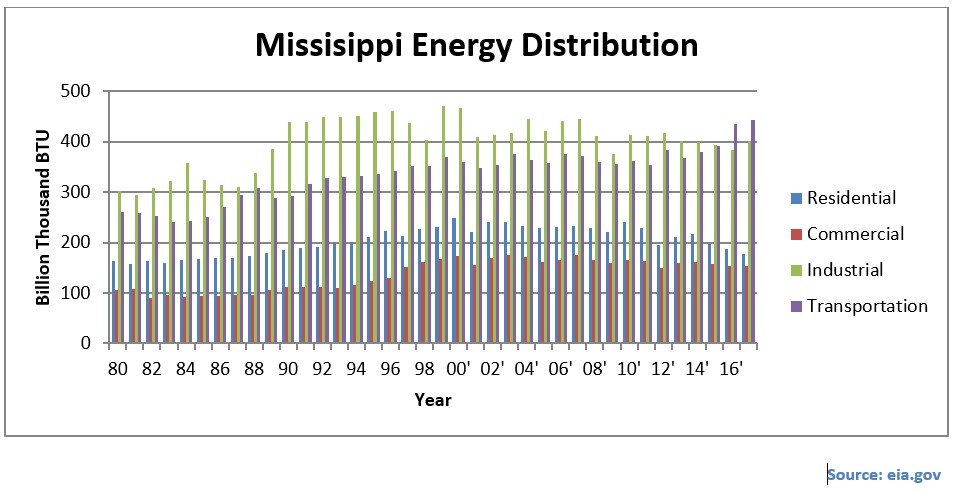
Mississippi:
Recently, the transportation sector (nearly two-fifths of the state total) has taken over the industrial sector (nearly one-third) of Mississippi’s energy consumption. The manufacture of motor vehicles and other transportation equipment, food, beverage, tobacco products, chemicals, machinery, etc. are substantial contributors to the state’s economy. The strong demand for electricity for cooling during summer and heating in winter, along with the state's energy-intensive industries, helps to put Mississippi near the top one-fourth of states in per capita energy consumption. Overall, Mississippi consumes more than three times energy as much as it produces.
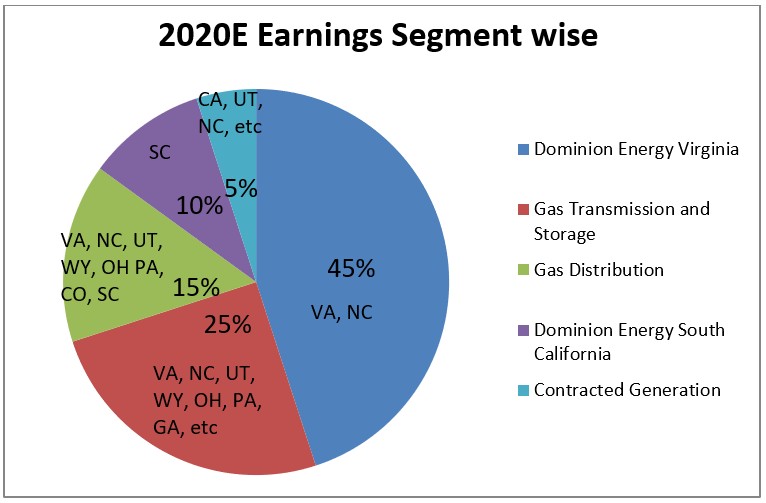
Dominion Energy:
Dominion Energy operates in four major segments serving in more than 40 states of which Dominion Energy Virginia and Gas Transmission and storage raise more than 70% of its Earnings. Virginia and North Carolina are the major areas focused.
The below graph represents the population growth over the years where Dominion has its major operations:
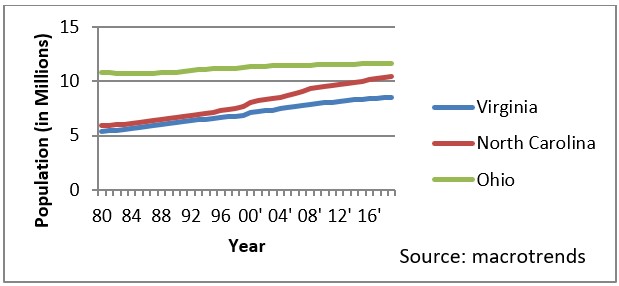
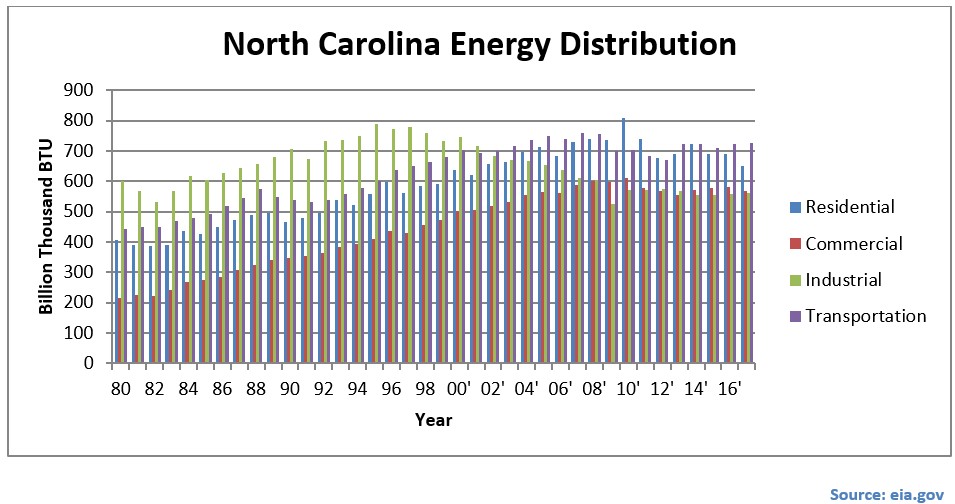
North Carolina:
The residents, tourists, and truckers who use motor gasoline and diesel fuel on North Carolina's heavily traveled highway system and the jet fuel consumed at the busy Charlotte Douglas International Airport—one of the top U.S. airports as ranked by passenger traffic—make the transportation sector the largest end-use energy-consuming sector in the state. The residential sector follows the transportation sector, accounting for one-fourth of North Carolina energy consumption. The commercial and industrial sectors each consume slightly more than one-fifth of the state's energy. The state’s other key industries include aerospace and defense, auto and truck manufacturing, biotechnology and pharmaceuticals, etc. Total energy consumption per capita in North Carolina is among the lowest one-third of all states.
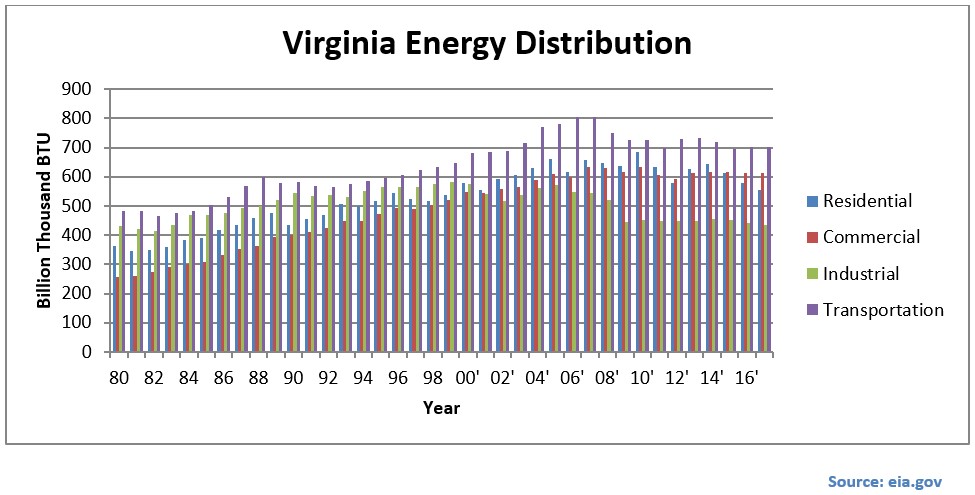
Virginia:
Energy consumption in Virginia is about two and a half times greater than the state's energy production. The transportation sector consumes three-tenths of the energy used in the state. Virginia has the third-largest state-maintained transportation network in the nation, including six major interstate highways. More than a dozen railroads operate on 3,500 miles of railway in the state. Virginia also has several commercial airports, including two near Washington, DC, that are among the nation's busiest, and one of the nation's largest seaports, the Port of Virginia at Hampton Roads. The commercial and residential sectors each account for about one-fourth of the energy consumed in the state, and the state's industrial sector consumes nearly one-fifth. The per capita energy consumption is higher of Virginia as compared to that of North Carolina.
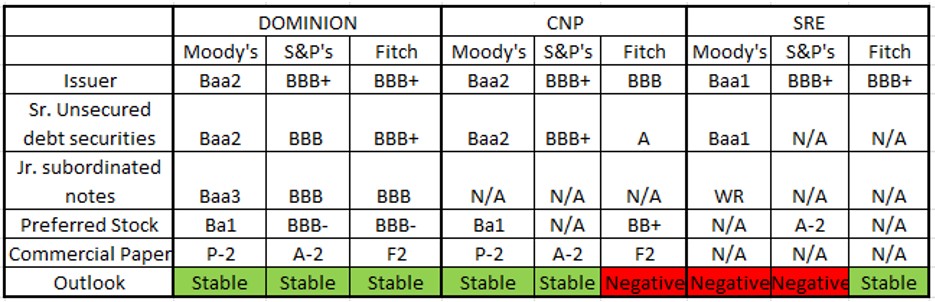
Credit Ratings:
Credit ratings are issued by credit agencies and are used to gauge the risk associated with the ability of a company to meet its financial obligations. It can be a deciding factor on whether the companies do or do not receive a loan. Major credit agencies like Moody’s and Standard Poor’s (SP’s) are based in the United States and controls over 80% of the rating market, while Fitch controls approximately 15%. Investor’s often base part of their decision on credit ratings to buy corporate bonds, as it directly impacts the yield and the earnings but sometimes it matters to even invest in the common stock.
Based on the credit ratings by major agencies, it is advisable to invest in DOMINION as it has a Stable Company outlook and better ratings as compared to CNP and Sempra.
(Data Source: Bloomberg)
Other factors driving the Energy Industry:
There has been a drastic transformation in demand, supply, and energy distribution across the end uses—buildings, industry, and transportation. The U.S. energy enterprise is engaging the challenges of energy security, economic competitiveness, climate change, and other environmental issues, driven by a variety of factors ranging across technology readiness, market demand, and public policy.
Weakening economic growth, not only in the US but also in Europe and China, ongoing trade tensions, which can create uncertainty and dampen economic growth, other political risks including the US election cycle, the outcome of the Brexit process in Europe and the tension between the Middle-East countries affect the energy sectors.
According to the most recent results from EIA, about one in five households reported reducing or forgoing necessities like food and medicine to pay energy bill and 14% reported receiving a disconnection notice for energy services. Many of them reported keeping their house at an unhealthy and unsafe temperature.
Share of Energy used by Appliances and consumer Electronics Increases in US Homes:
Over the past few decades, the share of residential electricity used by appliances and electronics in the U.S Homes has nearly doubled, while the federal energy efficiency standards were enacted on every major appliance, overall household energy has decreased.
Increased domestic oil and gas production:
Over the past decade, we have seen the bullish optimism and limitless investment and the lows of the price crash and extended oil downturn. The adoption of technology to recover oil and gas from “unconventional” resources has significantly increased proved reserves and production of oil and gas. Beyond increased economic activity in the energy sector; the benefits of improved oil and gas accessibility in the United States include vastly reduced oil imports, an improved investment outlook for energy-intensive industries.
Decreasing growth of gasoline consumption:
After twenty-five years of virtually uninterrupted growth, gasoline consumption began to decline in 2008 and has been relatively flat since 2011. Between the decrease in demand for fuel and the increase in domestic supply, net imports of oil and petroleum products have decreased by 35% since 2011 and 50% since their peak in 2005. Global oil prices also fell by almost 50% during the latter half of 2014, driven by a combination of increased supply in the United States, reduced economic growth forecasts in the developing world, and a dynamic geopolitical environment.
Increased deployment of smart grid technologies:
More than 1,300 digitally connected phasor measurement units and millions of smart meters were connected to the electrical grid. These devices and advanced communication networks are allowing unprecedented visibility of the operation of what many call “the largest machine on earth.” The volume, variety, and speed of the newly available data streams are at the early stages of improving grid management.
Slowing growth of electricity consumption:
Growth in U.S. electricity demand is at its lowest level in decades. In the residential and commercial sectors, which now account for approximately 74% of electricity consumption, the adoption of significantly more energy-efficient devices has played a major role in this decline. Policies that promote energy efficiency are partly responsible for this adoption, while technology shifts to more appealing and effective devices that are more energy efficient (e.g., mobile computing, flat-panel monitors) are also a factor.
Increasing opportunities for U.S. manufacturing:
The availability of lower-cost natural gas and natural gas liquids has created an advantage for U.S. manufacturers that use these resources for heat, power, or chemical feedstocks. This has contributed to some expansions and additions to the U.S. petrochemical manufacturing sector. The industrial sector as a whole can similarly benefit from low-cost natural gas.
Growing market for electric vehicles:
Over the past four years, electric vehicles have successfully carved out a niche market. Plug-in electric vehicle (PEV) sales went from virtually zero in 2010 to approximately 240,000 by 2018. These sales include premium vehicles, such as Tesla Model S, and mass-market vehicles, such as the Nissan Leaf and Chevrolet Volt. At current levels of market share, these vehicles do not materially change the overall energy demand or emissions profile of our national energy economy. However, because adoption tends to be regionalized, the use of PEVs is changing electricity consumption patterns at the local level, and the vehicles are prevalent enough to require thoughtful planning for public charging infrastructures.
Present Economic Conditions:
Since it first grabbed headlines with its initial outbreak in China, coronavirus has been at the top of mind for people around the globe. This has been negatively impacting the stock market around the world.
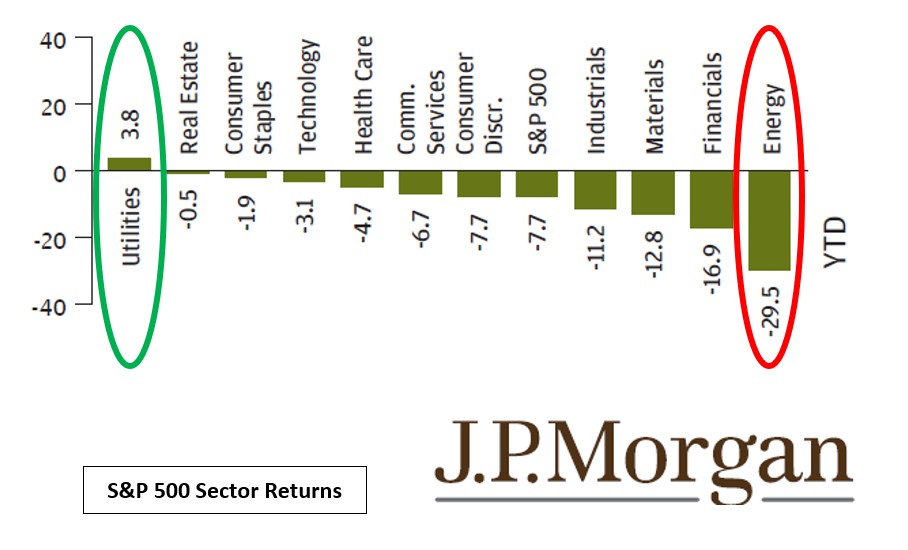
Utility stocks are the only segment of the American market not in the red this year, as the coronavirus outbreak prompts investors to huddle in classically defensive companies that promise cash returns better than bonds.
All three companies in our report generate major revenues from the Utility sector. Utilities companies’ business is not very macro-sensitive. “We will use energy whether or not we have a recession”
Conclusion:
The year 2019 marked another year in the evolution of the energy system in which the market forces, technological development, declining federal regulation affected the changing profile of the energy workforce. Despite one of the highest levels of employment in recent U.S. history, the traditional energy and energy efficiency sectors continued to outperform the economy, adding 152,000 new jobs. Demand growth for efficient technology and building upgrades has driven expansion across many traditional industries including construction. Investments in energy infrastructure continued to grow in 2019 with the number of construction companies reporting most of their revenues coming from utility investments increasing with an accompanying dramatic increase in construction jobs.
References:
https://www.macrotrends.net/stocks/charts/SRE/sempra-energy/revenue
https://www.kff.org/other/state-indicator/distribution-by-age/?activeTab=graphcurrentTimeframe=0startTimeframe=10selectedDistributions=children-0-18--adults-19-25--adults-26-34--adults-35-54--adults-55-64--65selectedRows=%7B%22states%22:%7B%22california%22:%7B%7D,%22texas%22:%7B%7D%7D%7DsortModel=%7B%22colId%22:%22Location%22,%22sort%22:%22asc%22%7D
https://www.vox.com/2019/4/18/18412380/climate-change-2019-energy-natural-gas
https://www.statista.com/statistics/206097/resident-population-in-california/
https://www.macrotrends.net/states/texas/population
https://www.eia.gov/state/seds/seds-data-complete.php?sid=AR#StatisticsIndicators
https://www.energy.gov/sites/prod/files/2017/03/f34/qtr-2015-chapter1.pdf