- Introduction
The concept of Lean was introduced by Toyota to improve their productivity. It simply means eliminating waste from a process. Customers only pay for value added activities. But most often, more than 70-90% of activities done by an organization falls under non value-added activities. By eliminating them, the productivity increases immensely. Lean is more of a philosophy and emphasizes on continuous improvement.
Even though Toyota applied Lean philosophy in a manufacturing context, it can also be applied to IT Product Management. In this article, I will be explaining how we can significantly improve Product Management by using some of the methodologies of Lean.
- Queuing Theory
Before delving into IT product management, it is important to understand the reasons for failure in a project and Queuing theory helps to understand it. We have all seen queues building up in supermarkets on an everyday basis. Imagine waiting at a supermarket checkout counter.
There are basically 2 components that define the queue length
- Average Arrival rate which defines the average rate at which customers arrive at a queue
- Average Service rate is the average rate of providing service to the customers
This is summarized by Little’s law which states that
Average Inventory = Average Flow Rate * Average Flow time
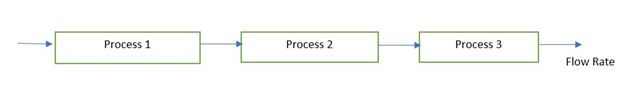
In a service industry, the average inventory is nothing but queue length. If there are multiple serial processes, then each process is analyzed separately. The overall flow rate depends on the process with smallest capacity.
Process Capacity = Min {Capacity of resource 1, capacity of resource 2, capacity of resource 3} = Flow rate
Bottleneck is the process with the lowest capacity.
Utilization of a server = Flow rate of server/Capacity of server
This can be computed for each server. Utilization will be the highest for the low capacity resource and equal to 100%
As the utilization of server increases, the length of queue also increases. But it should be noted that it will not be a linear increase. A common misconception is that queues start to form only after the resource is more than 100% utilized. But this is not true.
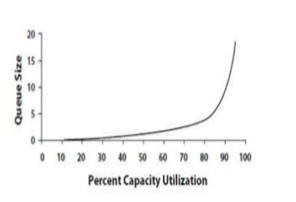
Fig1: Queue Size Vs Utilization
As it can be seen in above graph, queues start to build up exponentially after reaching a server utilization. This is because of the stochastic nature of the process. There is variability associated with both arrival rate and service rate.
- Suppose at a given instant, more customers arrive at a queue, then the strain on the server increases tremendously at a very short interval of time. Since the capacity is finite, queue starts to build up.
- Similarly, the service rate can also vary depending on the number of items to be billed. Hence at a particular instant, when service rate increases and the arrival rate is uniform, then also queues start to build up.
- Application of Queuing Theory in IT Product Management
The same concepts can be extended to Product Development. If a project follows Agile methodology, the product functionalities go into Product backlog. These form the backbone of development and based on the Sprint cycles, the delivery of features is decided. One of the main issues with Product development is variability associated with the process.
There are two metrices that needs to be continuously monitored
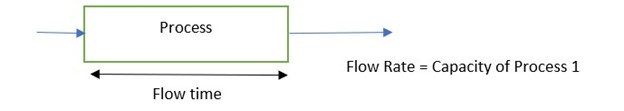
- Lead time – It is the time taken between customer request and delivery date
- Cycle time is the time taken to by the project team takes to finish a task. It includes both service time and queue time.
Product managers tend to view the process as deterministic i.e a system without variability. But more often than not, there is variability factor that needs to be taken into consideration. The variability of completing a task can be due to various reasons like running into unanticipated issues, unexpected resource constraint, waiting, etc.
- Queuing Model
3.1 Single Arrival system - M/M/1/infinity Model
A queue can be a single arrival or batch system queue. A single arrival system is a basic model in which a single item comes in a queue. It is denoted as M/M/1/infinity. M represents Markovian which means that it is a stochastic system where probabilities of future state will not be known from present state. Let us study the characteristic of queue in this system.
Cycle time = Queue time + Service time.
We can study the distribution of Cycle time (CT) /Service time (ST) Vs Capacity utilization. As mentioned before, this will not be a linear increase of CT/ ST against utilization due to
- variability of requests arrival rate
- variability of processing time depending on complexity, availability of resource, etc
Hence it can be the case that
If service time = 2 weeks and queue time = 2 weeks, then cycle time = 4 weeks. Cycle time/service time = 2X.
This ratio depends on the capacity utilization. Queue starts to build up long before 100% utilization is reached due variability. Hence at 50% utilization, Service time/Cycle time can be 2X and at 100% utilization, it can be 10X depending on the variability of system.
3.2 Batch Systems – M[x]/M/1/infinity model
In a real product development, requirements come in batches. It is generally a set of requirements bundled into one. This can be compared to a batch system in queuing. In this case the queue starts to build up even at lower utilization of resources than single system.
Here if the service time is 2 weeks, queue time can be 8 weeks and hence cycle time = 10 weeks. Cycle time/Service time = 5
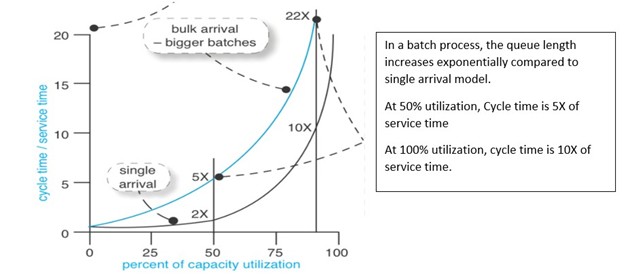
Fig 2: Waiting behavior of M/M/1/infinity and M[x]/M/1/infinity system
In reality, requirement generally come in batches. Or even if a team works on a single requirement, it is usually complex and can be broken down into multiple small requirements. But as can be seen in the above graph, as batch size increases, there is an exponential increase in waiting time.
Another common mistake done in product management is to strive for 100% utilization of team members. It slows the entire development process. It gets even worse as the team members switch from one task to another. Context switching, as it is referred to, hinders the overall progress of the project. It results in a bunch of WIP queues – information, partly completed code, untested code, etc. None of this can be considered as a single workable unit.
The major issue in Product management as opposed to Manufacturing is that these queues are generally visible in manufacturing. Hence when inventory starts to build up, it can be immediately identified and acted upon. However, in Product management, queues are not visible. Hence most teams do not understand how it impacts their project’s progress.
- Kanban in IT Product Management
Enter Kanban. It solves all the problems discussed above. It is a Japanese methodology that has been successfully used in manufacturing for decades. It is used to tightly control the material flow in the system so that inventory does not build up. It is used in pull systems where an item is replenished only if there is a requirement from customer.
It can be similarly used in Product management to tightly control the WIP queue. It takes the variability of process into account and thereby helps to manage the WIP queue. It also acts as a visual aid i.e it helps the team to see the build up of queues and fix it immediately.
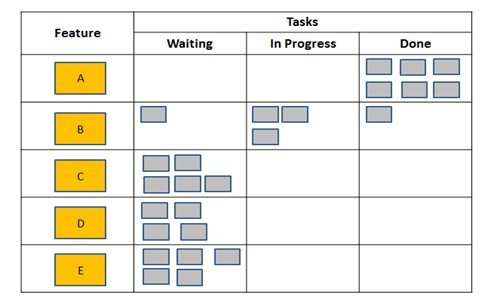
Fig 3: Kanban Board
A simple Kanban board can be seen below. It consists of product features. Each feature is partitioned to small chunks of work that can be independently worked on. By doing so, we can employ team members to parallelly work on a feature rather than sequentially. As we begin to start working, items are moved from ‘Waiting’ to ‘In Progress’ column. And once a task is completed, it is moved to ‘Done’ section. This way Kanban board helps us to visually see the progress of project.
The important thing to control in order to limit the queue length is the number of tasks in “In Progress” section. Depending on the complexity, the WIP queue limit is fixed. If it is equal to 5, then only 5 tasks can be worked upon at a single point of time. Once a task has been completed, then we can move on to the next one.
The core idea behind limiting WIP is to reduce the no of jobs done concurrently.
- Cumulative Flow Diagram
Cumulative Flow Diagram (CFD) is another diagrammatic representation for identifying queue. The Backlog, In progress and Done jobs are plotted every day to see the amount of work done.
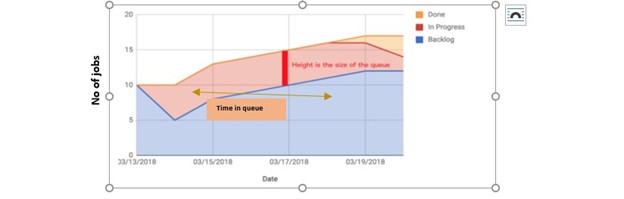
Fig 4: CFD
The height represents the size of the queue or the WIP on a particular instant. From the graph, it can be seen that the WIP is continuously increasing. The horizontal brown line represents the time spent in queue which is equal to 4 days in this case. Not only that, the backlog ideally should reduce as more tasks are worked on but it is also increasing. This situation is very common in Product Management.
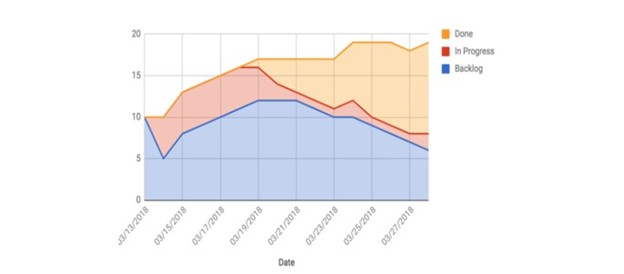
Fig 5: Ideal scenario
Now we will see the ideal scenario where Product Managers want to be. In this case, the Done jobs are continuously increasing. The height between the red and blue bar which represents the queue build up is continuously decreasing and the backlog section is decreasing.
- Measures to reduce Queuing
- Reducing WIP – Smaller Batch sizes
Smaller batch sizes are the way to control the WIP queue. As the batch size reduces, variability of the flow decreases. Hence continuous flow is achieved, queue size starts to reduce and agility is achieved. It also reduces contextual switching where team members switch from one task to another. By working on smaller batch sizes, teams will focus on finishing that task completely.
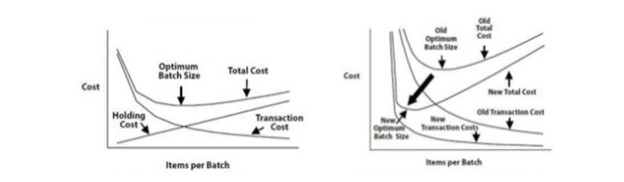
Fig 7: Effect of Batching on Total Cost
This can be proved using the Economic Order Quantity (EOQ) model. The optimum batch size is determined using the left graph. EOQ is the optimum batch size that should be ordered by the wholesaler (say) from the manufacturer. It minimizes the Total cost of ordering which includes the transaction cost and the holding cost. The entire objective is to reduce the total cost.
Similarly, it can be used as a framework to determine batch size in Product management. As it can be seen on the second graph, by reducing the transaction cost, new optimum batch size is reduced. The converse is also true and that is what Product Managers should do.
Hence by reducing the batch size, reduce your transaction cost. This can be achieved because any unwanted time spent on fixing issues will be reduced with smaller batch size. With more focus, they can easily fix problems that they may encounter. The basic idea behind lean is to identify and fix issues as soon as possible before moving to the next stage. As the product starts to build up, the amount of time to fix bugs increases exponentially.
Whenever the WIP starts to build up, it can be easily identified using CFD or Kanban boards. Then the product manager must investigate the root cause behind the delay and fix it.
The idea behind using Kanban is to produce a defect-free product and then move it to the Done section. Initially it may be difficult to instill this discipline in team. But it will save a lot of time and effort at later stages of product development.
- Reducing WIP – Manage Utilization of resources
Another thing that should be kept in mind is the utilization of resources. If there is only one critical resource for a critical activity of project, then care should be taken while assigning their work. As seen before, overloading any resource is only going to result in project delays. If it is absolutely imperative to finish a task soon, then additional resource should be appointed to speed up the work.
- Algorithms for Sequencing jobs
There are different types of algorithms that helps to determine the sequence of activities. Each task has a cost of delay (COD) associated with it. Even though a thorough calculation is not required, Product Managers usually get a feel of the activities with highest impact. If the cost of delay is the same for all jobs (which is highly unlikely), then a better way would be to do the shortest job first. Suppose if job durations are same but the COD of a job is different, then it is better to do a job with least cost. If both vary, then you can prioritize by dividing the COD/Duration and tackling the highest value job first. There are many more scheduling algorithms used and it totally depends on the type and complexity of the project.
- Wastes in IT Management
We conclude the section by talking about the different types of wastes in IT Product Management. Lean emphasizes on the elimination of wastes. There are generally 7 wastes in Lean Manufacturing that can be mapped to Product Management as below
Inventory | Partially done work |
Overproduction | Delivering extra features not wanted by customers |
Over-processing | Relearning |
Transportation | Handoff |
Waiting | Delays |
Motion | Context Switching |
Defects | Defects in product |
- Partially done work – This can be minimized by using Kanban and limiting the WIP queue
- Additional Features – This is analogous to Overproduction in Manufacturing industry. Traditional Lean focuses on Pull system i.e to produce only those products that are in demand to avoid excess inventory. Often, Product teams focus on unnecessary features and waste their time and effort. Marketing teams should be effective in gathering the actual requirements from customers and working on them. Focus should be on quality and not quantity. And one of the definitions of quality is to meet the customer expectations.
- Relearning – It is the redoing the same thing again and again. It can be repeated learning of same thing which reduces the efficiency. Collaborative working can eliminate this.
- Delays – In a manufacturing organization, delays are often caused by bottleneck resources. In a Product development context, this can be a resource waiting to start work due to internal dependencies. Not only that delays can also happen at review stage where the product has to be approved. Stakeholders do not review immediately and come at a later stage with issues. This increase the overall work of project team.
- Handoff – Whenever information is passed from one team to another, knowledge gets lost. This increases if teams work in silos. Instead by working collaboratively, teams can understand the problem statement better and work together towards a common goal.
- Context Switching – It involves jumping from one task to another. This reduces efficiency of programmer as they need some time to adjust and get the rhythm of it.
- Defects – Defects cause extra work. By having smaller batch sizes and fixing issue then and there, this can be reduced significantly
References
- https://hbr.org/2012/05/six-myths-of-product-development
- https://itsupplychain.com/the-importance-of-lean-manufacturing-in-the-post-covid-19-world/
- https://less.works/less/principles/queueing_theory#QueueingTheory
- https://kanbanize.com/blog/economic-problem-with-queues-product-development/
- https://kanbanize.com/blog/kanban-is-more-than-sticky-notes-on-the-wall/
- https://medium.com/swlh/minding-your-ps-and-queues-flow-management-by-queueing-theory-1b45dcd27e33
- https://cdn2.hubspot.net/hubfs/273765/Lean%20Practices%20for%20Call%20Management%20-%20Enterprise.pdf
- https://www.scaledagileframework.com/safe-lean-agile-principles/