Purpose Statement:
The purpose of this case study is to survey organizational employees on the effectiveness of self-monitoring dashboards created based on correlations and combinations of several measurements.
The employees at an organization would eventually need to feel greater accountability and increased efficiency in their work by interacting with this customized interface.
Research Question / Hypothesis
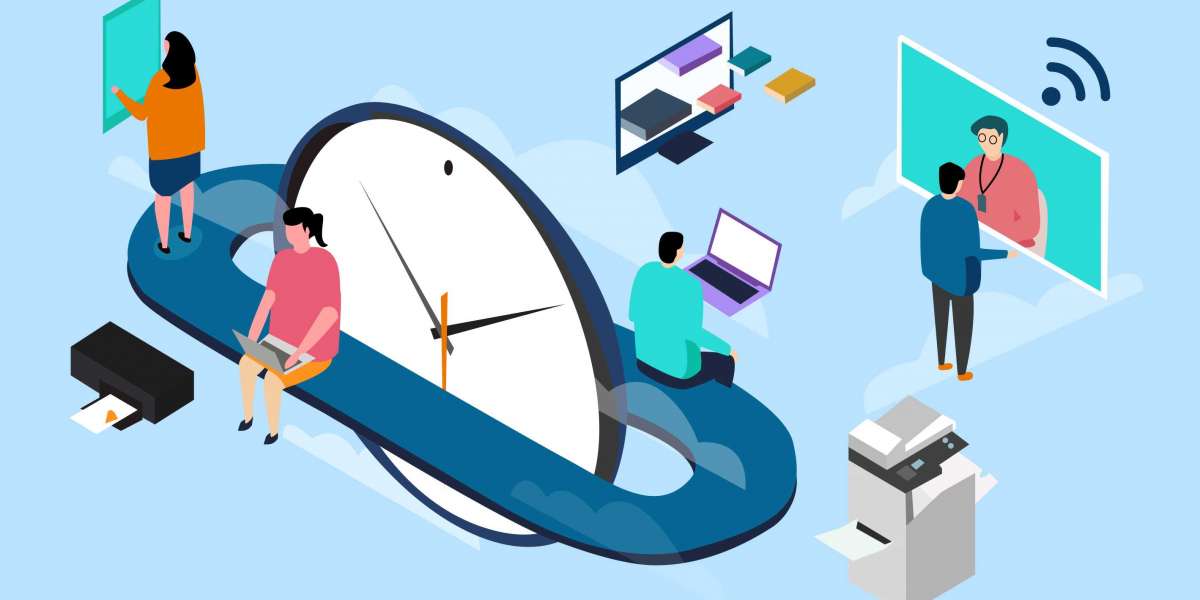
Employers are finding it more manageable to allow employees to work remotely to have more flexibility while maintaining productivity goals (Shellenbarger, 2012). With the world moving on to a more remote working culture, it is even more urgent that employees learn to set a routine and work around it. This is where wearable technology comes in. The idea here is to give the employees the power and means to track their performance and help them improve their overall health and routine while saving time.
Target Audience
A total of 500 employees working for more than 20 hours per week would need to be selected for this research. The number of average experiences in years could range anywhere from 2 to 10 years. Domain area of interest would be software engineering/developers, marketing analytics/product managers, data scientists etc. These roles include a mix of data-oriented tasks (code, BI tools, cloud computing) as well as communication (presentation, email, phone calls).
Methodology
Phase 1: Identifying Design Elements
We must find elements that are of interest to each domain to refine our dashboard based on user feedback itself. Finding the metrics to be incorporated that will keep users actively engaged and instil curiosity to learn more.
The assumption here is that the company already has a tool to track or monitor its employee’s productivity. A summary of an employee’s time spent would be the first page of the interface to provide contextual details. E.g. top programs used, email stats and responsiveness rate, active times and longest time active are few of the metrics.
For easy correlation, we can also provide a feature that allows employees to drill down by day and hour to compare productivity and self-behaviour data side by side.
Most people would want to further personalize the dashboard insights to better fit their individual needs. The next phase would include integrating shared data and evaluating the entire team’s communication, i.e. time spent on discussions or in meetings, training or helping co-workers. Developers, for instance, might need time spent on tests, commits, interruptions in tasks and so on.
Phase 2: Finalizing Research Design
Data is generated from the wearable devices or physiolytics can help monitor various scenarios and detect health-risks. Stress, sedentary behaviour, physical inactivity, fatigue are all important measurements that can be aggregated for real-time analysis.
The company can use this information to understand the general sentiment of the workplace without explicitly asking the employees. Real-time monitoring of occupational stress may facilitate the collection of subjective responses about the source of the stress (Milosevic 2012).
I would start with the three main areas of interest; endpoints (desktop, mobile, laptops virtual terminals). App usage or Application monitoring would be one of the pillars that must need to be tracked by a combination of time spent executing tasks. Internet activity monitoring is another common technique wherein our model would segment all the URL’s on a scale from not helpful to highly productive depending on the query or pages being visited. Email monitoring is the third pillar with the content of the mail being assessed to identify how close to the corporate domain it is. E.g., many employees rely on email exchanges and the threads can be analysed looking for collaborations, service requests and documentation. Wearable device data can be used to calculate sleep quality by training daily sleep data and the input provided by the user. The classifier algorithm takes sleep duration, awake time, average skin temperature to derive an indicator on its own over a period. These indicators can help in self-regulated learnings where employees can monitor which activities are stressful or boring. Heart rate, blood alcohol levels, blood glucose levels and activity can be used to calculate a stress indicator for the employee.
Phase 3: Analysis
Part I
The idea behind this is to help people gain better self-understanding and empowered self-improvement through personal data. Python allows you to aggregate, collect and clean up our data easily. We will design widgets for each employee that would be customized based on his/her metrics (differ among departments).

We will calculate reports metrics and application usage information by using the Flask framework by using middleware. Depending on the application framework, the mechanism of executing code before and after a request is processed will differ. The setup_metrics() function is defined in the middleware.py file. The setup_metrics() defined as shown:


Finally running the docker function which has an application input option for us to track will give us detailed metrics about usage. A snapshot of the detailed interactive dashboard:

The dashboard can be drilled down into more insights with time spent on each type of activity plotted. Moreover, we can observe how the volume of workload and adherence contributes to capacity utilization and understand the crucial hours spent in multiple tasks being executed.

Part II
The main agenda here was to use wearable devices to engage employees through data.
The wearable data can be exported in XML format which can be parsed in Python and fed as a CSV. The important metrics we will be looking at: Heart rate, Resting Walking/Running Rate, Distance walked, Energy burned in calories, sleep quality etc. The data can be cleaned and displayed in the format shown for creating a dashboard.

We can customize any dashboard we need to implement by visualizing the data points we discussed.

Average Sleep / Weekday

These are just two of the analysis shown. Depending on the employee’s personal need, we can show an hourly breakdown of the sleep quality, blood pressure, resting calories and more.

The final dashboard for self-monitoring will be derived from the correlation an employee can observe and improve upon. It would be flexible and interactive with an interface that would be a combination of application usage as well as wearable device data. A snapshot is shown below:

Productivity is the final score calculated considering all employee metrics that can be qualitatively explained. Capacity utilization, quality of work and task completion are all sub-components of the productivity score.
Challenge Mitigation
Privacy: The survey will need to consider the sensitive workplace data is not to be shared with any employee’s teammates or managers unless he/she has given access or view permission. The employees must feel that they own their captured data. Besides, they should always be allowed to disable trackers to pause data collection.
User Engagement: Employees shouldn’t feel intrusion between their work and all tracks must be in the background. The only message that should go to them is in the form of a daily feedback interface, a rough overview of their dashboard with suggestions or ways to improve it according to the employees liking.
This main audience we hope to select for this survey lies more towards the general employees who are more willing to quantify various aspects of their life and use it for self-improvement.
Conclusion
This collective self-assessment interface would be an extremely powerful tool for the employees to take quick effective measures to optimize the workload and improve mindfulness while performing any tasks. It is difficult to measure productivity and link it to any health metric as what works for one employee might not work for another. There are many more human behaviours factors that come into play.
The main reasons employees stress in the workplace is related to huge workloads, intimidation by supervisors, achieving deadlines and lack of support. Through this self-monitoring tool, one might hope that employees understand their mind and end up being more open with the management to facilitate seamless task execution on their part.
We will circle back to the employees given the survey to ask how they perceived this dashboard to be and if they made any observations into how they spend their time. Moreover, the feedback would entail which tasks needed collaborating and when did they usually feel nervous, stressed or overall unproductive. All these points will help the employees self-learn and excel professionally as well as in personal life.
References:
Jayden, K., Melkas Helinä, Jari, P. (2018). Tapping into the wearable device revolution in the work environment: A systematic review. Information Technology People, 31(3), 791-818. doi:http://dx.doi.org.ezproxy.neu.edu/10.1108/ITP-03-2017-0076
Ryan Olson Jamey Winchester (2008) Behavioral Self-Monitoring of Safety and Productivity in the Workplace: A Methodological Primer and Quantitative Literature Review, Journal of Organizational Behavior Management, 28:1, 9-75, DOI: 1080/01608060802006823
Holland, P. J., Cooper, B., Hecker, R. (2015). Electronic monitoring and surveillance in the workplace: The effects on trust in management, and the moderating role of occupational type. Personnel Review, 44(1), 161-175. doi: http://dx.doi.org.ezproxy.neu.edu/10.1108/PR-11-2013-0211
Meyer, A., Murphy, Zimmermann, Fritz. (2017). Design Recommendations for Self-Monitoring in the Workplace: Studies in Software Development. Proceedings of the ACM on Human-Computer Interaction, 1(CSCW), 1-24.
Mettler, T, Wulf, J. Physiolytics at the workplace: Affordances and constraints of wearables use from an employee's perspective. InfoSystems J. 2019; 29: 245– 273. https://doi-org.ezproxy.neu.edu/10.1111/isj.12205
Francisco de Arriba-Pérez, Manuel Caeiro-Rodríguez, Juan M. Santos-Gago. (2016). Collection and Processing of Data from Wrist Wearable Devices in Heterogeneous and Multiple-User Scenarios. Sensors,16(9), 1538.