Today, it has become more important to process the data created by the users who use the products and services of the companies at much higher speeds. Thus, more reliable data could be obtained in terms of providing better service to customers and tracking the product variety. In addition, infrastructural parameters such as developing software technologies and cloud solutions have increased the diversity of data processing. While a structured database was sufficient before, the tools used to process and make sense of unstructured data and their diversity have also developed in this period. Therefore, open-source tools such as Python have become frequently used in data processing by going beyond the tools such as database, data processing and transformation that come to mind when it comes to data processing.
In this article, we will introduce data processing by referring to the basic functions of pandas, Python's data processing library.
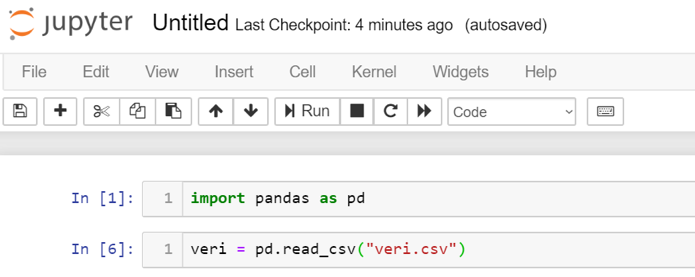
In your Python code, you must first import the "pandas" library. The accepted standard for this is as follows. It is recommended to use it this way so that different people can easily understand your code;
import pandas as pd
After importing the library in our code, our first job is to access the data we are going to process. Since data can be kept in different environments, pandas offers solutions to data access with different methods:
- CSV (Comma separated) : read_csv
- From database: read_sql
- From JSON formatted file: read_json
Accordingly, the sample code should look like this: Let's assume that the file name with the data is "veri.csv".
veri = pd.read_csv(“veri.csv”)
With this code, we load the data in the "veri.csv" file into the "dataframe" object. The operations to be done after that will be done in the memory of the computer. Therefore, the size of the loaded data should not be more than the computer's memory and there should be enough space for other applications to run.
You can try the above-described operations on jupyter notebook as follows. If the dataset is loaded, it moves to the next command line without any errors.
In this way, after loading the data, we may want to examine the data first and examine which columns are in it, what data type these columns are, or general simple statistics. The following functions can be used for this.
We may want to see the first or last rows first. The last lines can be used to check that all the data we want is loaded properly. The functions to be used for this are the head and tail functions.
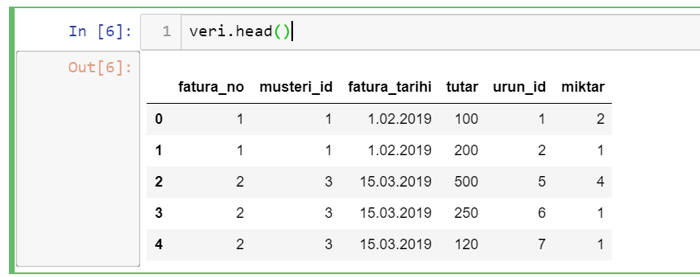
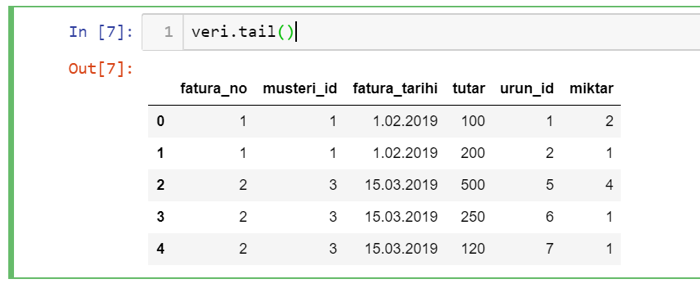
You can also pass the number of lines you want to see as a parameter to the head and tail functions. If no parameter is given, it will only display 5 lines.
If you want to reach summary information on the data set in general after seeing the data, you can use the info function.
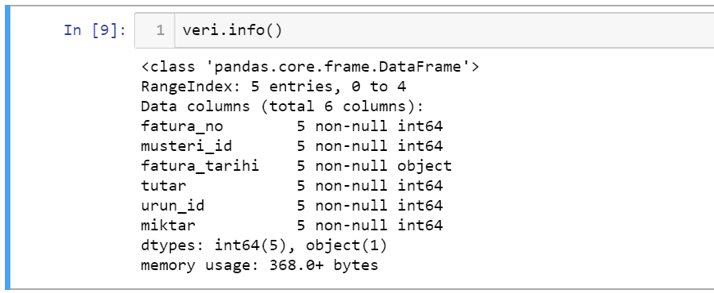
Accordingly, in the output of the function, you can examine at a glance the types of columns in your data, the number of non-null records, how many columns of each data type and the index range.
Finally, if you want to examine the simple statistical distributions of the columns you have, you can do this with the describe function. This function will produce the following output.
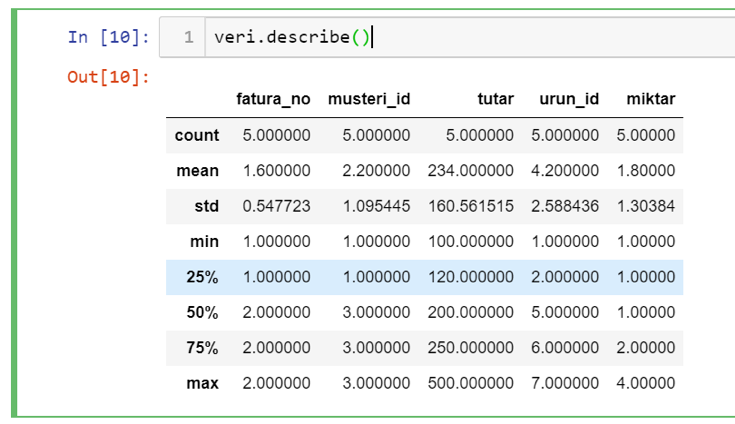
Accordingly, the smallest, largest and average values of the column sets in your data as well as the percentile slices can be monitored over which values can be reached. It is a very useful function for quickly examining your data distribution, especially for measurement-based fields.
In this article, I simply tried to explain how to load a data set and how to recognize it.


