Objective: The business goal of this project was to develop a churn prediction model by identifying the major factors leading to it.
Significance:
- The subject of customer retention, loyalty, and churn is receiving attention in many industries.
- The unceasing competition in the market has caused companies to divert their focus more towards customer retention rather than customer acquisition.
- Research has repeatedly shown that existing customers spend more, purchase higher-margin products/services, and are more likely to refer to additional customers.
- So, how do you avoid the high price of constantly replacing existing customers with new ones? Thus, it becomes extremely essential to identify the factors causing a customer to switch and take proactive actions in order to retain them.
Data Description:
- The data is a real-world set collected from Kaggle, consisting of 7034 observations and 21 variables.
- The data set has 4 numerical variables and 16 categorical variables.
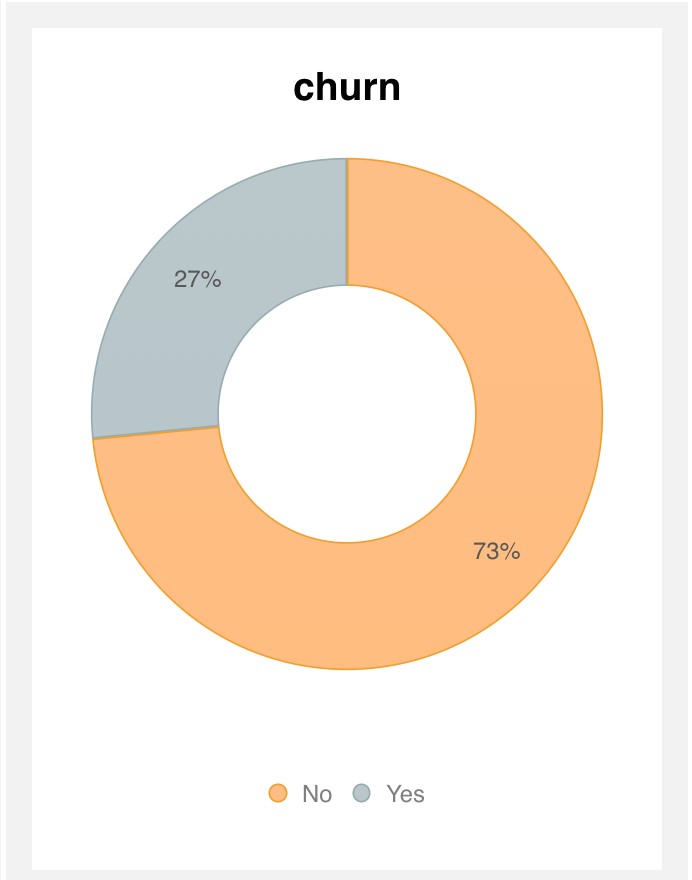
- The last column is churn - representing the customers who left in the last month, yes (27%) and those who did not leave, no (73%) is the output variable (y).
- There are only 11 missing values, all of them for the TotalCharges column. Moreover, these are exclusive for the customers whose tenure = 0. So, we can conclude and replace these missing values with 0.
Feature Selection:
- The 16 categorical variables were converted into numerical variables(binary) by creating dummy variables that give a total of 31 variables.
- The correlation map presented that many variables were highly correlated, thus, they were eliminated for model building.
- RFE was performed on the remaining variables and depending upon their rank, the best features were selected.
Logistic regression model:
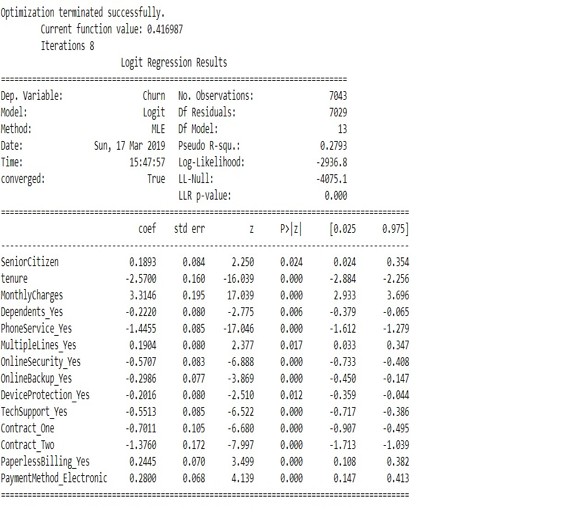
- After selecting the features and splitting the data set to 70:30, logistic regression was performed using the Sklearn package.
- Interestingly all the variables proved to be significant as the p-value for all of them was less than 0.05.
- This suggests that the model is a good fit i.e. it shows good convergence.
Decision tree:
- The decision tree algorithm was applied to the data set using the same significant variables.
- The accuracy resulted was 73%.
Analysis:
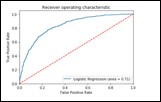
- As shown in the confusion matrix, the logistic regression model gives us an accuracy of 72.7%, an average precision rate of 79% and f1-score of 0.79
- The ROC rate(area under the ROC curve ) is around 71% which proves that the model is a good fit.
- The decision tree model also gave an accuracy of 73%, which is quite similar to that of the logistic model.
So, both of the models are a good fit for this data.


Results:
Out of the given variables, I have screened these variables as the most significant metrics (KPIs):
- Tenure
- Monthly Charges
- Phone Services
- Multiple Lines
- Senior Citizens
- Dependents
- Online Security
- Online Backup
- Device Protection
- Tech Support
- Contracts
- Paperless Billing
- Payment Methods
Summary:
After learning the KPIs, it becomes easy for the companies to focus on the significant metrics and make business decisions based on them to retain their customer base.