Overview
Identify the Problem
- Too many giving reports on different tools
- No instructions for finding giving information
- Users don’t know where to find giving data so they spend a lot of time searching
- The reporting team can’t understand the real needs for giving data or reports
Objectives
- Help users faster access to the giving information they are looking for
- Help users gain productive insights into UT’s development priorities
- Help the reporting team better understand users’ needs for giving data or reports
System Concept
- The system should be able to provide commonly needed information based on what users want and give instructions for users to help them locate specific giving information/reports.
- The system should also keep track of users’ requests for giving information to help the reporting team build their reports to meet users’ expectations.
Methodology

Overall Process

Research

Analyze
Findings
There are 3 major reporting tools and users often jump between them:
Tableau: Provide interactive data visualization of summarized giving reports categorized by functions, years, schools, etc, which allows users to filter, download, and edit a report summary.
Cognos: Allow users to search for specific giving data in the past years based on their requirements. They can download the raw data in a spreadsheet to do their analysis.
VIP System: Record the detail of each individual or corporation that makes contributions to give.

Key reports:
Tableau: Key Fundraising Activity Progress Report, Prospect Management Metrics Report, Campaign Reports, Annual Giving - Quarterly Billing Report and Donor Participation Report, Corporate Giving Report, Request a Report
Cognos: All Prospect Research - PF06 and PF21
VIP System: Corporate Funding Record, Prospect Research - Prospect
Key features:
Capacity, CSU, MSA, HH Giving, prospect manager
Work Activity Affinity Diagram (WAAD): Interview Notes

Workflows
Map out the steps of how users utilize and interact with the reporting tools focusing on the key reports and key features. The workflows are based on user scenarios and are categorized by reports.

Chatbot Opportunity
After mapping out the user flows, I used the Jobs to be Done framework to analyze the Chatbot opportunities. By doing that, I identified the step in the workflows a chatbot could add values to:
Jobs To Be Done: A framework to define the user activities (steps of completing the tasks) and identify steps that could include chatbot interference.
Chatbot Value: What a chatbot could do to help users achieve their goals or complete their tasks.
Provide clear instructions/clarifications for users to locate the reports.
Create a continuous experience with easy transitions between pages.
Find or filter data for users to reduce the manual processes.
Human + Chatbot Journey Map: A mapping that captures both the users and the chatbot’s activities.
Chatbot Opportunity Mapping
This mapping represents the outcome of the above analysis including Activities, Chat Values, and Human + Chatbot Journey Map. For the mapping, I will use the Corporate Giving Report as an example:


Human+Chatbot Journey Map

Design
Full Conversation
Full conversation represents not only the actions but also the “conversations” between the user and chatbot. To create a full conversation, I added the statements to the Human + Chatbot Journey Map to captures the "conversations". For this mapping, I will use the Corporate Giving Report as an example. The full conversation can also serve as an inventory/menu of the chatbot.

Prototypes
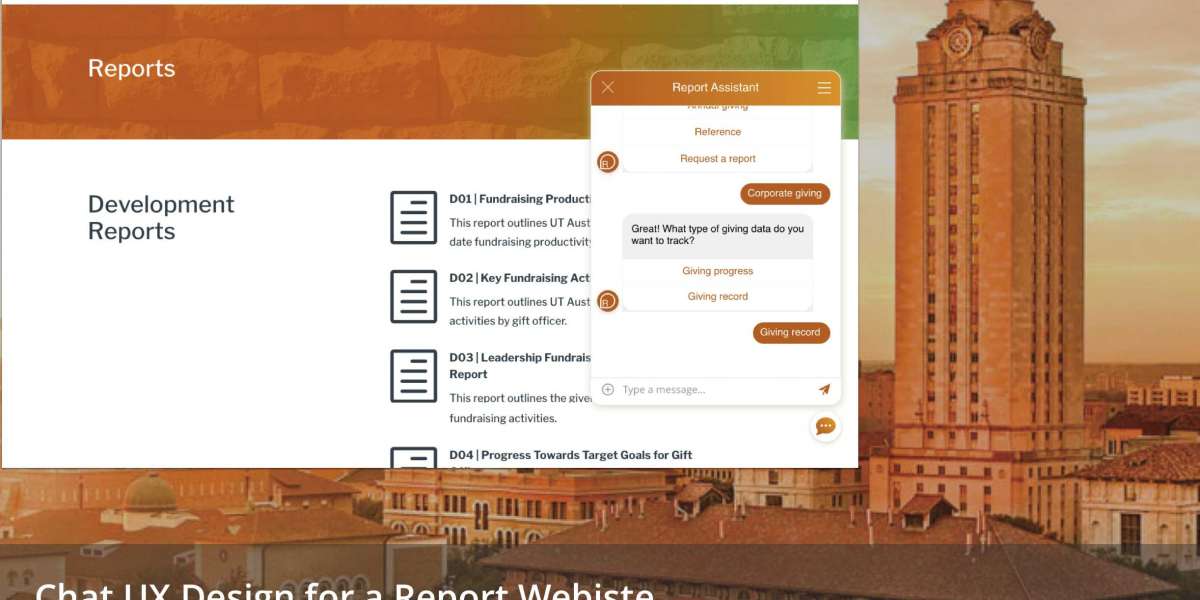
Use Corporate Giving Report as an example to highlight what the real interface and interaction would look like.

Reflection
What's Next
Due to the limited time, I was only able to focus on the key reports and key features based on my interviews with users given by the stakeholders. The final deliverables, a full conversation, and a prototype example can be seen as the design concept for the project. But more questions need to be answered when it gets into the technical details, and real user feedback needs to be included before moving forward to a complete prototype. Below are the next steps I proposed:
Work with engineers or data scientists to talk about feasibility and limitations on implementation.
Test the prototypes with targeted users from the development offices.
Revise the “conversations” (inventory).
Include more scenarios/reports in the design concept.
What I Learned
How to leverage user input to tailor the scope:
The original goal was to focus primarily on the tableau reports on the giving website. But as I talked to more users, I found out that the users would use different tools for one scenario instead of for different purposes, This required them to transit between multiple tools quite often and even invent their ways to complete their work. So I decided to tailor the scope to include not only the tableau reports but also the relevant reports in other reporting tools.
How to deliver the right amount of design in a limited period:
I collected a considerable amount of user feedback to conduct my research analysis. But I can't cover all the scenarios in an initial concept delivery. So I utilized the survey results and usage data to and leverage all the information altogether. I was able to identify the best opportunities to build the concept: I mapped out the full conversation for only the major scenarios and created a prototype example based on one detailed scenario to showcase the interfaces and interaction.
How to impress my stakeholder and show the value of UX:
In the early research phase, I couldn't present sufficient summarized findings from the users. So I showed whatever user feedback I got to my stakeholders every week, which helped engage the stakeholders in the early process and educated them on what UX was like.
How to get me up to speed to an unfamiliar topic:
Chatbot design was a new area for me. So I connected with an expert and consulted with her at major checkpoints to evaluate my work. I was able to take advantage of the expertise and second-hand experience for my project.
